Handling Outliers
1. Check for outliers on the graphs
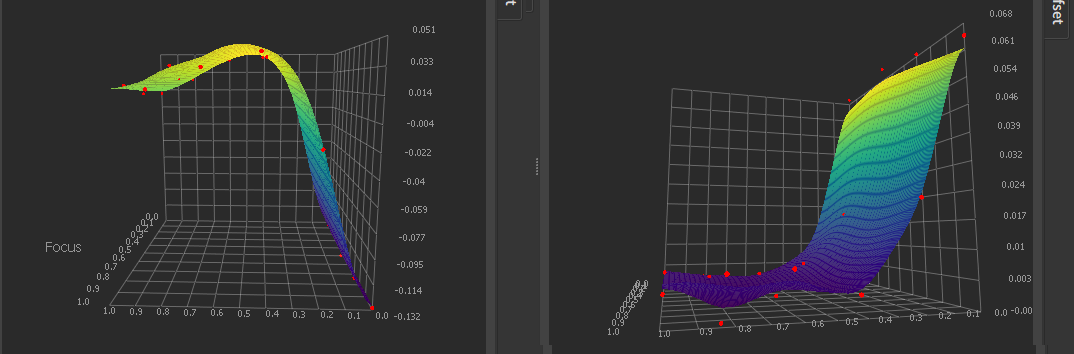
In the Refine workspace, look at the graphs on the right side. The red dots are the measured points and the surface is the interpolated function. Do not worry about the interpolation for now, just look at the red dots. If a point is very different from its neighbours, or does not follow a tendency, it is an outlier.
For example, in this calibration there is an outlier in (1, 1):
2. Evaluate the outliers
An outlier is not necessarily a wrong point, so it is interesting to check some other metrics.
2.1. In the raw data table
Go back to the Process Workspace and look at the corresponding row in the Raw Data Table:

Here, the score is very high, which indicates an untrustworthy point.
In addition the calibration is only supported by 8 valid photos, this is about the limit and would require very good photos for the 8 of them to bring enough information for FOV and distortion.
2.2. In the picture browser
You can check how tags were detected in the pictures, in the browser on the right:
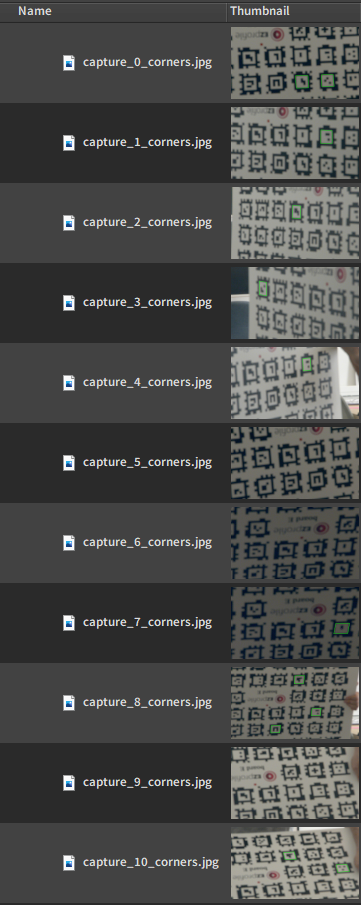
Here, all the pictures have very few detections, so there is not much information to work with for the solver.
2.3. In a render engine
This example is fairly caricatural and in some cases it can be useful to export the calibration and test in the render engine to see if a point should be removed. Also using the render engine is the only reliable way to fix wrong points in EZprofile rather than just deleting them.
Continue the Refine Workflow as if there is no issue, obtain a nice interpolation and proceed to the Export Workspace. Export to your render engine and test how the AR behaves around the suspicious point.
For more details, see how to Improve a Calibration using a Render Engine.
2. Remove the wrong points
If the diagnostic concludes that the point is wrong, it's row can be hidden or deleted in the Raw Data Table:

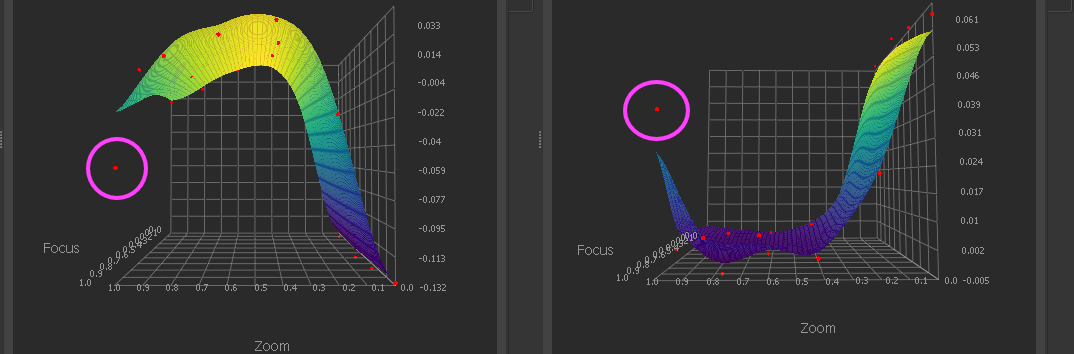
After removing this point, the curve tendency looks much better: