Refine
The third part of a calibration is checking and refining.
1. Handle outliers in the data
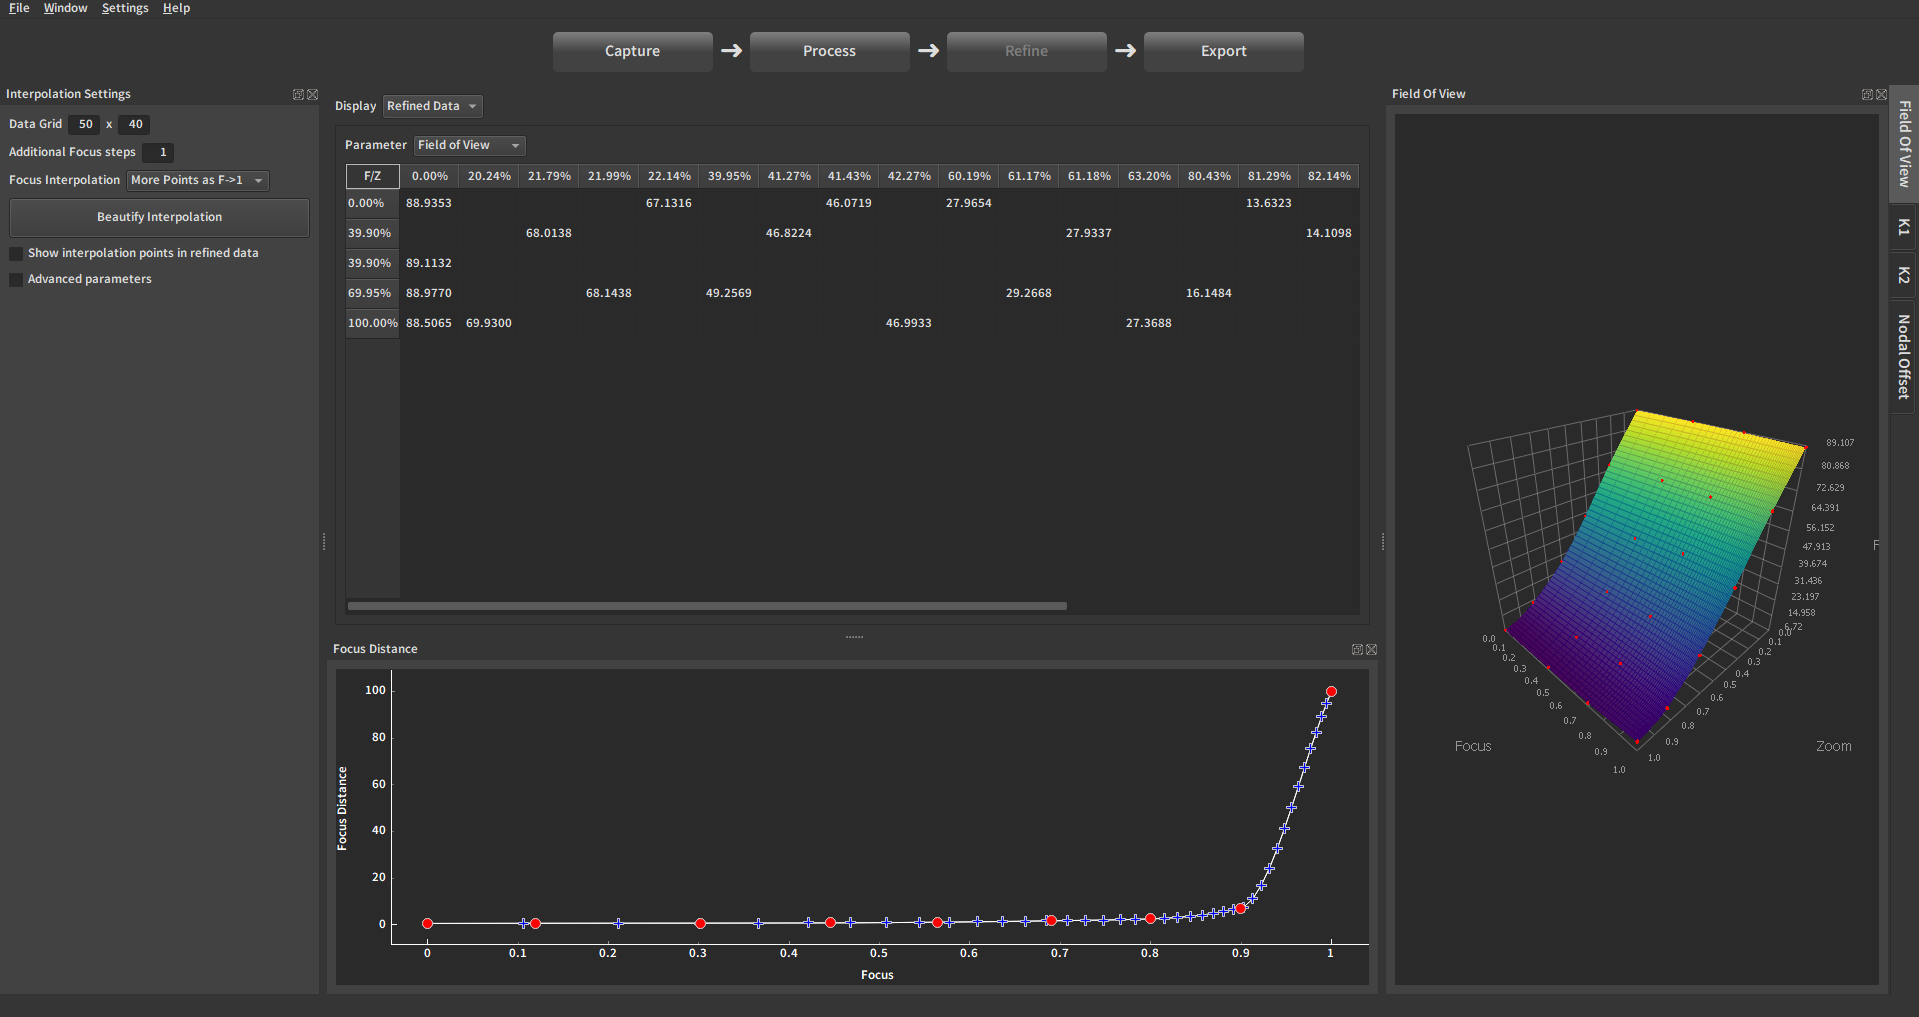
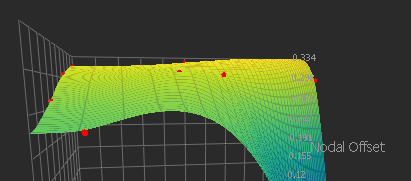
Look at the graphs. The red dots are the measured points and the surface is the interpolated function. Do not worry about the interpolation for now, just look at the red dots. If a point seems off, it is an outlier and should be dealt with.
You can look its Z/F position in the graph to find it in the Raw Data Table.
Detailed Tutorial : Handling Outliers
2. Define the export sampling
Define the sampling of the export in the menu on the top left:
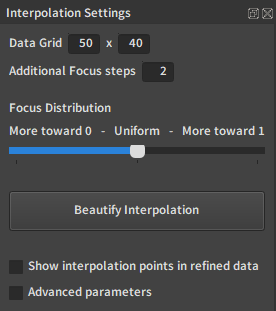
The most important option here is "Data Grid". It is the resolution of the exported grid in Zoom and Focus.
Detailed page : Interpolation Settings
3. Tweak the interpolation
One of the main features of EZprofile is the smooth interpolation between the data points. Such interpolation is however an ill-posed problem.
3.1. Look for interpolation errors
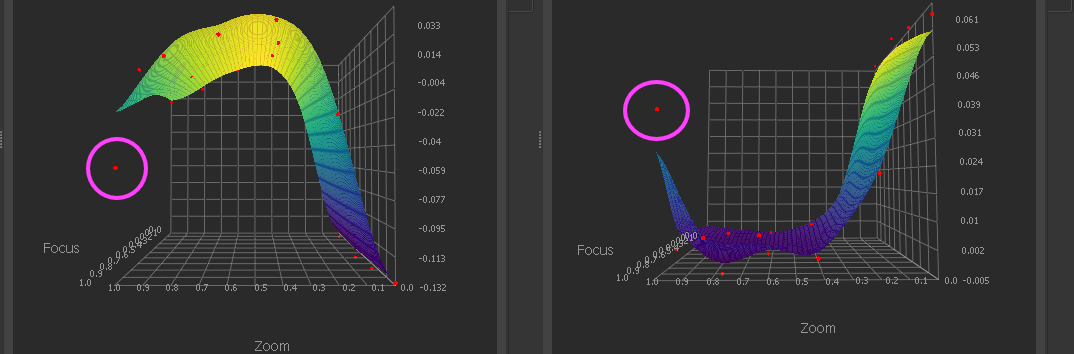
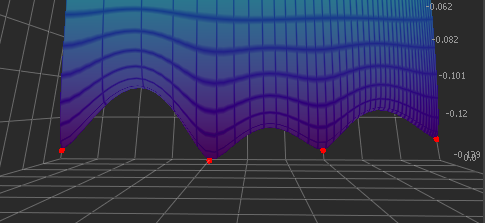
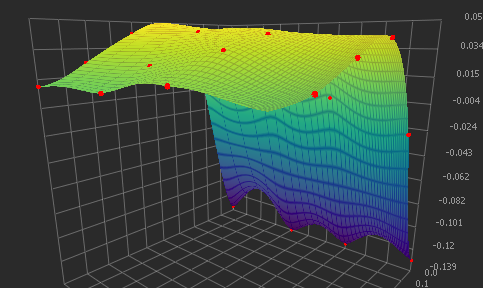
The main issue with doing a smooth interpolation in 2D is the introduction of unwanted bumps. They are most obvious on the edges of the graph but can happen inside too:
3.2. Beautify interpolation
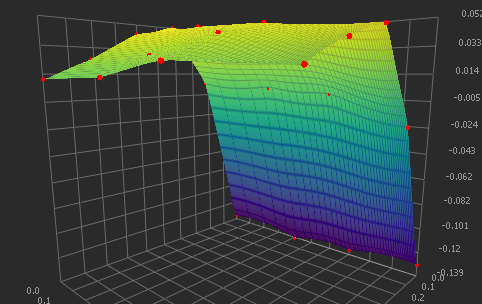
In most cases, a simple way to fix the graphs is to press the "Beautify Interpolation" button:

A progress bar will appear at the top right. When it is done, the curves will update automatically.
Before:
After:
3.3. Advanced parameters
The beautify button is a nice and quick way to produce usable curves, however the current optimization algorithm gives priority to going through the exact measured points and not overshooting. This tends to produce rather stiff curves.
It is however possible to edit the interpolation parameters manually to have a lot more control on the curve shape.