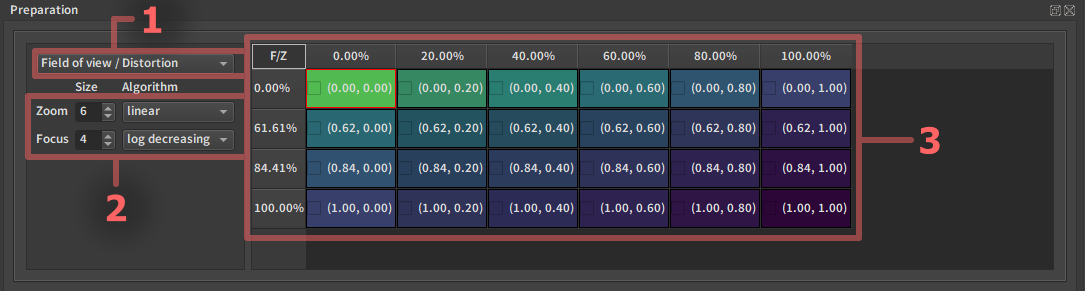
Preparation Table
1. Calibration Step
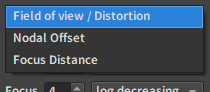
There is a different grid per calibration step. Center Shift calibration is only done once so it does not require a preparation table.
This drop-down button is never used in practice as the calibration switches automatically to the correct preparation table depending on the current step.
2. Grid shape Options
2.1. Axis Size
Number of row or column for the corresponding parameter. A more precise but time consumming calibration will need a denser grid than a fast calibration. The values by default are a medium ground for a calibration of good quality doable in about 1h.
2.2. Point Distribution
For each axis it is possible to change the distribution of the points.
The following distribution algorithms are available:
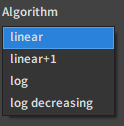
2.2.1. Linear
The points are uniformly distributed along this axis.

2.2.2. Linear+1
The points are uniformly distributed along this axis with a size reduced by one.
Then a point is added between the first and the second point. (here between 0% and 25% in the exemple)

2.2.3. Log
The points are distributed following an exponential distribution, putting more points near 0.

2.2.4. Log Decreasing
The points are distributed following a logarithmic distribution, putting more points near 1.

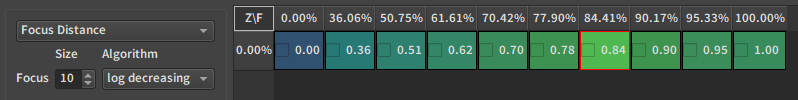
3. Z/F Grid
Usually the Up/Down direction is on the Focus and the Left/Right is on the Zoom, from the encoder values (0,0) in the top left to encoder values (1,1) in the bottom right. You navigate in the table by moving the control wheels on the lens. The colors indicate how far the current Z/F position is to the cells defined. Each cell is colored from purple to lime green to indicate the distance to it. The warmer the color the closer. In addition to this when either the Zoom or Focus is aligned with the value expected for a row or column of the table, the whole corresponding set of cells will light up brighter. When both Zoom and Focus are aligned with a cell within a margin of error, that cell's contours will become red.
For example, if you have finished a point at (0.4,0.6), and the next one you want to do is at (0.6,0.6) you can zoom in at the camera until the (0.6,0.6) point becomes circled in red in EZprofile. It can therefore be useful to have a feedback of the preparation table while at the camera. An alternative to know when you are on a point is to use the video Z/F overlay, that will turn red when you are on a point of the grid.
Note
When there is a single zoom step, the table is flipped so that focus is horizontal for better readability. This always happens for Focus Distance calibration, but can also be the case for other steps if there is no moving zoom, like for a prime lens. When this happens, the little F/Z symbol at the top left of the table is flipped into Z/F.
Focus distance grid:
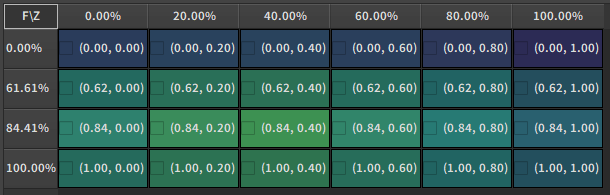
Field of view / Distortion grid for a prime lens:
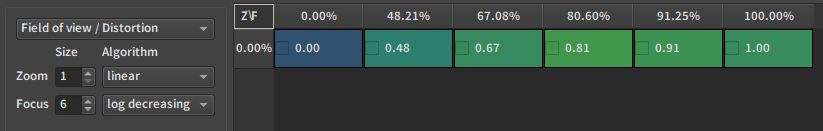
There are little checkboxes on the left of each cell. The calibration will automatically check boxes that have been done if the calibration point corresponds to a point on the table. You can also check yourself as a visual indication for other purposes if you want.
Note
It is not mandatory to capture the points shown in the table. It is just a guide to get an uniform density of measurements and accelerate the process.
Sometimes some of the points are very hard to capture. You can avoid doing them, especially if you don't intend on going in this domain often while using the lens, or pick an easier Z/F combination near the hard one. EZprofile does not need points to be on an uniform grid to compute the interpolation.
In these cases however the little box does not get checked so you can either check it yourself or remember the point was already done.
Back to capture workflow: Capture Workflow