Refined Data Table
1. Measured points view
To switch to this view uncheck the Show interpolation points in refined data box:

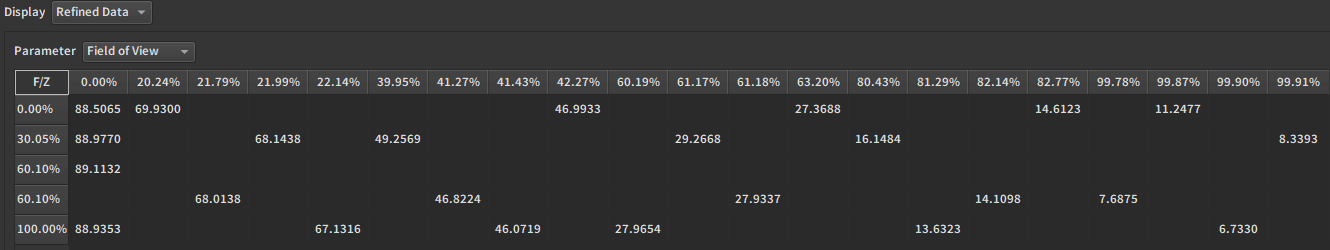
In this view, the table displays the interpolation value at the measured raw data points' coordinates. This is useful to check where the interpolation strays away from the measurements.
2. Exported grid view
To switch to this view check the Show interpolation points in refined data box:
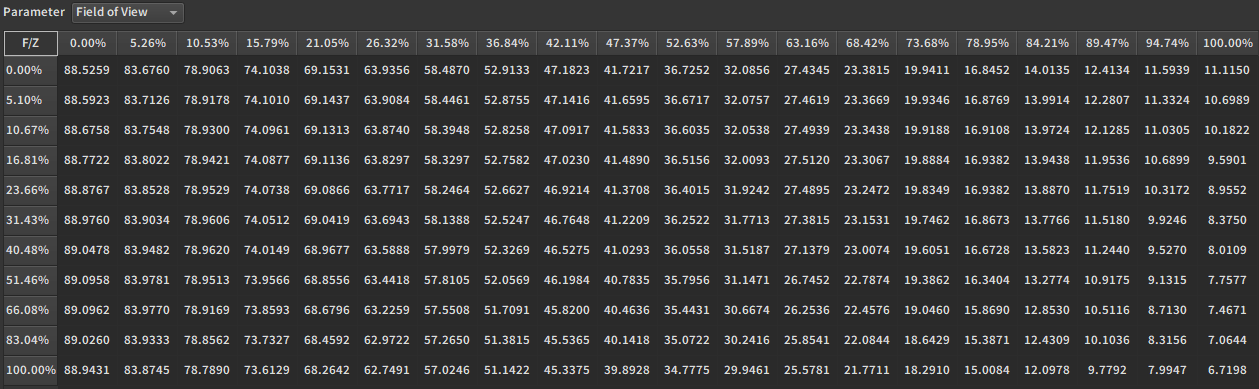
In this view, the table displays the interpolation values at the exported grid points. This is useful to debug an exported file or just to have a flat view of the graph with the exact values it goes through.
3. Change the parameter displayed
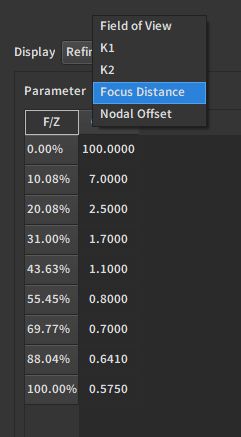
Use the Parameter drop-down menu to choose which calibrated parameter to display.
4. Change the distortion space
Each export has a different distortion space. When displaying either K1 or K2, there is an option to change the display space.
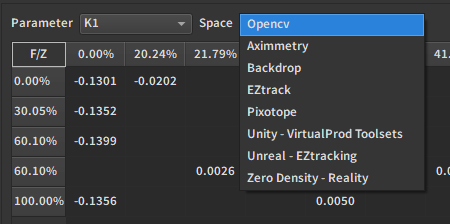
This also changes the distortion space in the graphs.
Tip
If you target a specific export, it is recommended to switch to that export's distortion space here before tweaking the interpolation, so that what you see on the graphs is exactly what you get.
"OpenCV" is the internal model used in EZprofile.